Book Value: the dollar value for all your contributions, including reinvested distributions
Calculating investment returns of funds is a simple exercise, but a common misconception amongst investors is to compare book value and market value (as shown on their fund statements), and mistake that for their return. In this note, we aim to address this misconception by explaining key concepts and illustrating the proper way for calculating returns.
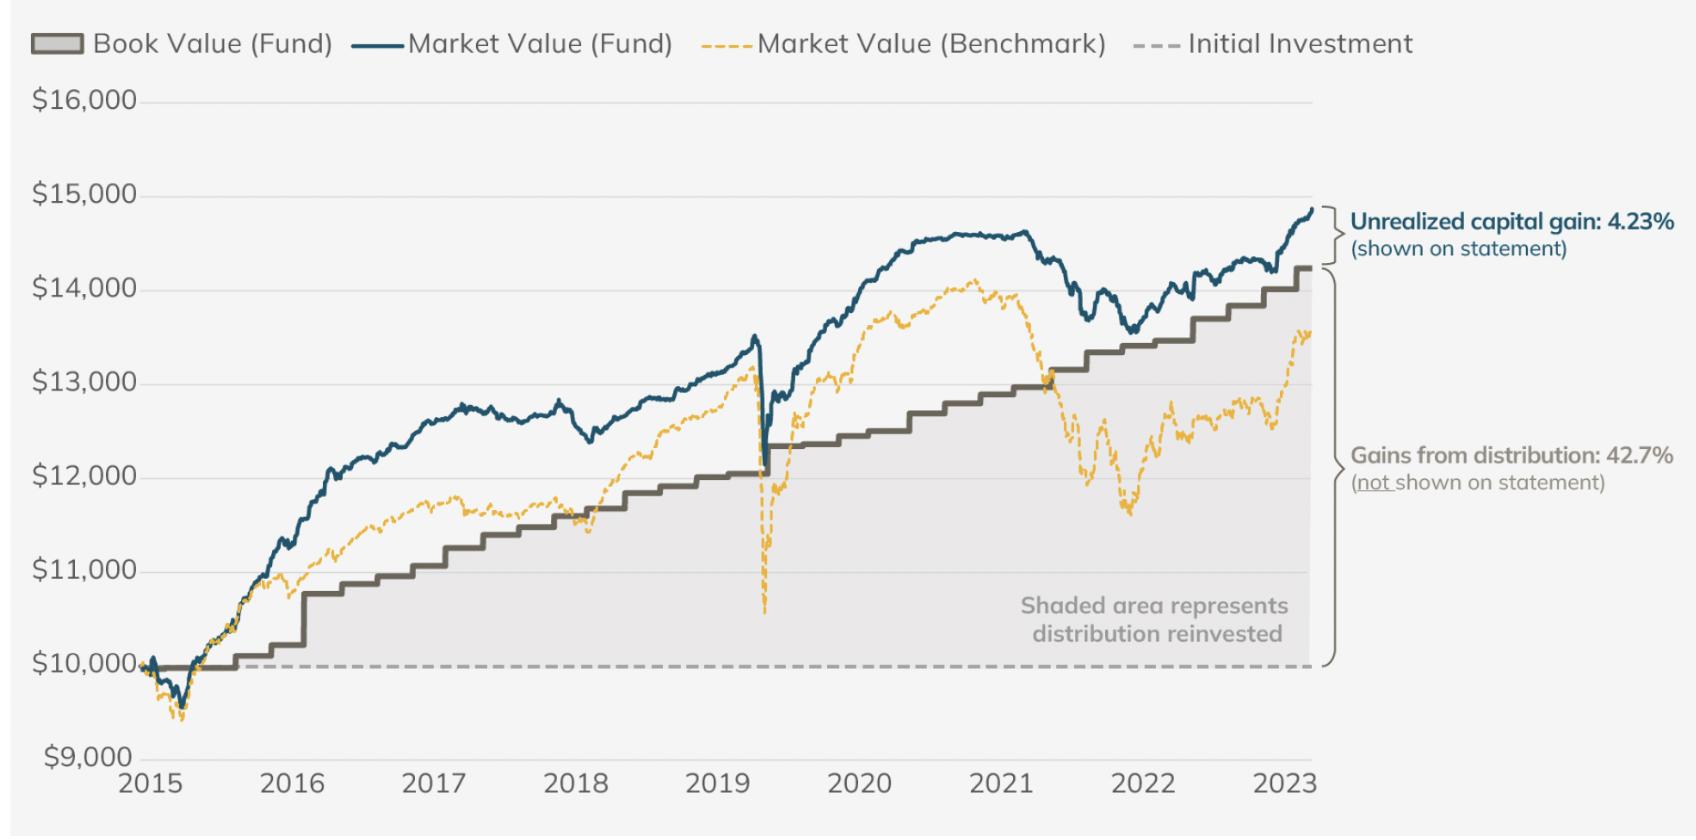
To help illustrate the challenge, let’s examine a sample fund statement in Figure 1, using the Picton Mahoney Fortified Income Fund as an example. The statement shows the fund’s book value and market value, but it lacks information on both the initial investment and the distributions paid to date. A simplistic comparison of market value to book value might suggest a mere 4.23% gain after investing in the fund for over eight years (based on the unrealized capital gain figure). However, the reality is that the investor earned almost 50% during this time period.
Figure 1: Sample Fund Statement Snapshot – Oct 29, 2015 to Jan 31, 2024
| Unit Price | # Of Units | Book Value | Market Value | Unrealized Capital Gain | |
| Picton Mahoney Fortified Income Fund Cl F | 10.67 | 1,393.38 | $14,267 | $14,871 | 4.23% |

Note: Assumes distribution reinvestment.
How? First of all, it’s important to understand that your total investment return = unrealized capital gains + distributions. Taking a closer look at this case, besides the 4.23% unrealized capital gains, the investor would have received $4,267 worth of distributions for the initial $10,000 investment, as shown by the grey shaded area in Figure 2. That is equivalent to a 42.67% gain. In general, if an investor were to simply compare book value and market value to assess total return, a significant portion of a fund’s investment return is overlooked.
Figure 2: Book Value vs Market Value Illustration: Picton Mahoney Fortified Income Fund Cl. F

Note: Assumes distribution reinvestment. From Oct 29, 2015 to Jan 31, 2024.
1 Benchmark is 75% ICE BofA Global High Yield Index / 25% ICE BofA Global Corporate Index (Hedged to CAD)
So, what’s the proper method for calculating investment return? That’s precisely what the next section aims to address.
Investment Performance Calculation
Calculating investment returns is easy, all it involves are:
- an investor’s initial investment
- what has been paid out to the investor in cash (distributions)
- the investment’s worth today (market value)
The formula is as follows:

Using the previous case of the Picton Mahoney Fortified Income Fund Cl. F, if an investor made an initial investment of $10,000, assuming reinvested distributions (to purchase more units), that investor’s total return is calculated as follows:

On a side note, book value (also known as adjusted cost base, or ACB) represents the dollar value for all your contributions, including reinvested distributions. This term is solely used to assess capital gains or losses for income tax purposes, not for performance assessment.
The Relationship Between Book Value, Market Value, and Distributions
Before we proceed, let’s break down the general timeline of a distribution:

Investors can receive distributions in two ways: cash or reinvested.
Distribution in Cash Scenario
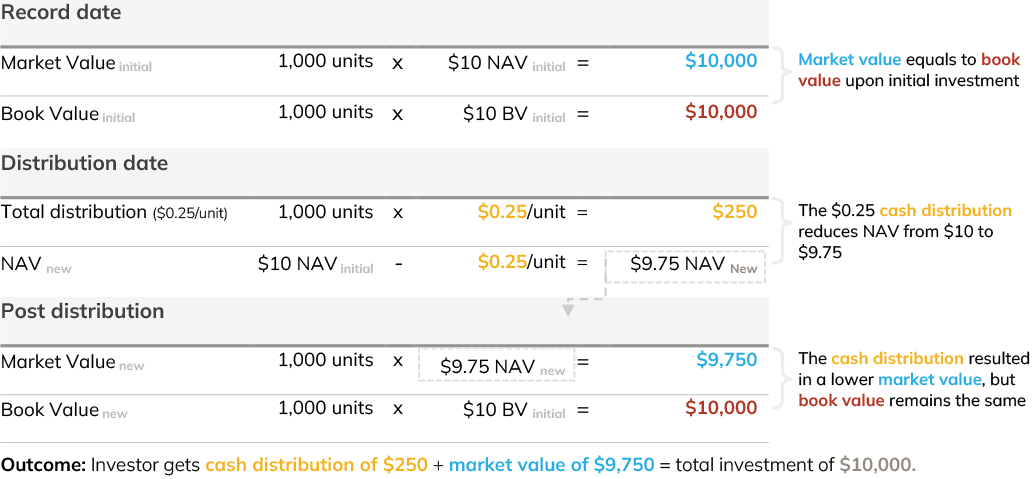
When a distribution is received in cash, the calculation is illustrated in Figure 3. At the end of this exercise, an investor receives a cash distribution of $250 and the fund’s market value decreases from $10,000 to $9,750. Essentially, a cash distribution results in a lower market value, while the book value remains the same.
Figure 3: Illustration of distribution taken in cash
(Assumptions: initial NAV of $10/unit, purchase quantity of 1,000 units, distribution of $0.25/unit, and no change in fund performance)

Distribution Reinvested Scenario
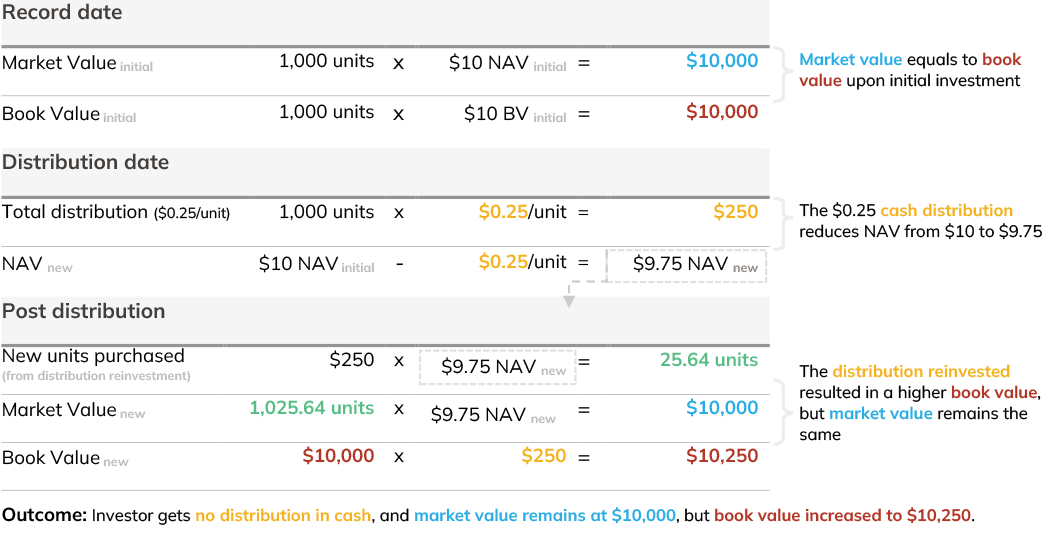
Figure 4 demonstrates the second payment method – reinvested distributions. At the end of this exercise, an investor receives no distribution in cash, and the fund’s market value remains at $10,000. However, the book value increases from $10,000 to $10,250. Essentially, in a scenario where distributions are reinvested, the result is a higher book value while the market value remains the same.
Figure 4: Illustration of distribution reinvestment
(Assumptions: initial NAV of $10/unit, purchase quantity of 1,000 units, distribution of $0.25/unit, and no change in fund performance)

Conclusion
In summary, it’s important to recognize that book value is not appropriate for calculating investment returns; it’s primarily used to assess capital gains/losses for income tax purposes. Fund distributions can either increase book value or decrease market value, depending on the type of distributions, despite no change in performance. Calculation of investment returns is simple. If you are missing any necessary information to conduct your own calculations, it’s best to reach out to your advisor for assistance.
Trailing performance table

Source: Morningstar Inc.
1 Benchmark is 75% ICE BofA Global High Yield Index / 25% ICE BofA Global Corporate Index (Hedged to CAD)


